Are you new to trading? Are you looking for a starting point to get your feet wet and familiarize yourself with the markets? Well then, look no further! In this blog post, we’ll dive into supply and demand zones – a great foundational concept for developing an informed approach to trading. We’ll cover everything from exactly what they are, how they work, why understanding them is crucial, and how you can implement them into your strategy. So stay tuned as we help guide you on the path of becoming a knowledgeable trader in no time!
Let’s Start With the Basics: What Are Supply and Demand Zones?
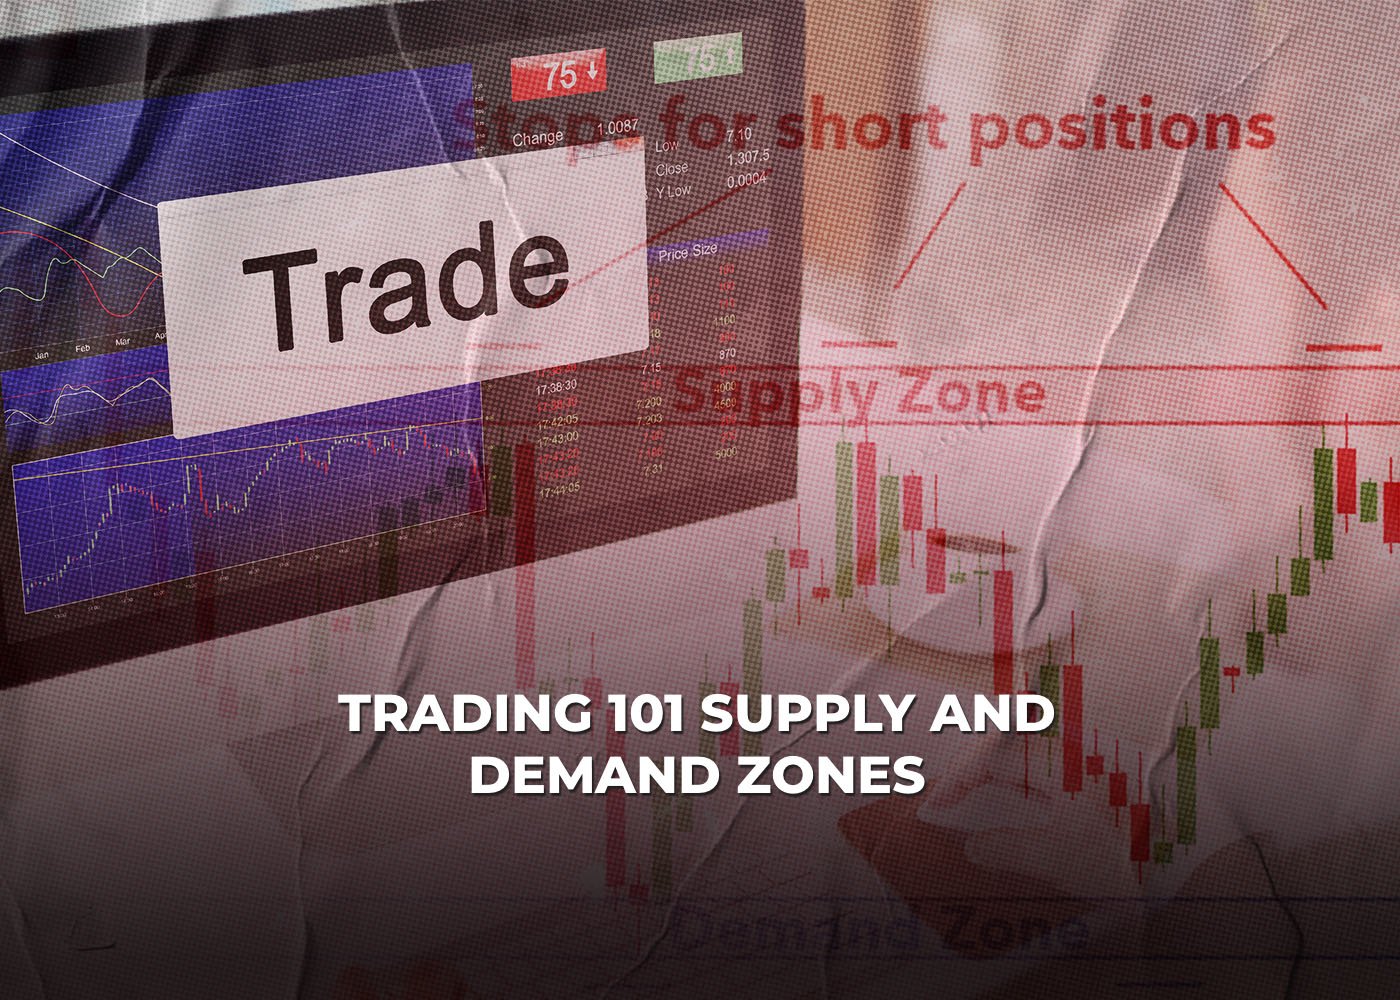
Supply and demand zones are pivotal points on a price chart that show where the level of sellers or buyers is higher than the other side, resulting in an imbalance. By understanding these levels, traders can identify key areas where there is a greater chance for reversal or continuation of the market trend.
When the supply of sellers outweighs buyers, a price zone is created where encountering selling pressure and potential resistance are likely. In simpler terms, this area is known as a ‘supply zone’ in which there are more sellers than buyers – leading to an inevitable decrease in prices.
Conversely, a demand zone is an area on the price chart where the purchasing activity from buyers outstrips sellers’ offerings. This creates support for prices as buyers compete with each other to purchase what’s available. In simpler terms, these regions see more buying than selling – which can lead to cost increases in those areas.
Utilizing supply and demand zones to inform trading decisions is an invaluable tool for traders, investors, and other market participants. Spotting such areas on the price chart can be done by recognizing prior reversals or sideways consolidation of prices and large spikes in volume or momentum. With this information at hand, people can enter or exit a trade with confidence -whether that means closing off positions before incurring losses through stop-loss orders, entering into profitable opportunities when they arise, or both!

Identifying Supply and Demand Zones:
Identifying supply and demand zones is a key aspect of technical analysis that involves analyzing price charts and identifying areas where the supply of sellers or demand from buyers is greater than the opposite side. Here are some steps to identify supply and demand zones:
- Look for areas on the price chart where the price has reversed: To pinpoint supply zones, you should search for locations on the price chart where prices have reversed from an upward trend to a downward one. For demand zones, seek out points on the graph where rates have shifted from a descending pattern into an ascendant direction.
- Identify areas of consolidation: Looking at the price chart, supply and demand zones can be identified by recognizing areas where the cost has leveled off or ranged. These regions could point to an equivalent balance of both forces or that a shift in their relationship is happening.
- Look for areas of significant volume or momentum: Identifying supply and demand zones can be done by examining the price chart for areas of extreme volume or momentum – suggesting a substantial move in either buyer/seller activity.
- Use support and resistance levels: Support and resistance levels can be employed to pinpoint areas of high supply and demand. Specifically, support marks the potential influx of buyers, while resistance points to possible sellers in the market.,
Supply and Demand Zones Are Critical in Trading
Supply and demand zones are paramount to making effective trading decisions, whether you’re entering or exiting trades, setting stop-loss levels, or taking profits. However, it’s essential to be mindful that supply and demand zones aren’t always precise and can shift over time – consequently, traders must keep an eye on price action so they can make necessary adjustments in their plans.


