Having completed the last week with the rise with the leading cryptocurrency Bitcoin, AVAX continues to rise with support from the EMA55 level at $ 17. Having faced sales from this region before, AVAX started the new week by breaking the 200-day average. AVAX, which had a quieter day yesterday, will start the new week more aggressively, and trade above the 200-day average will increase the expectations for AVAX.
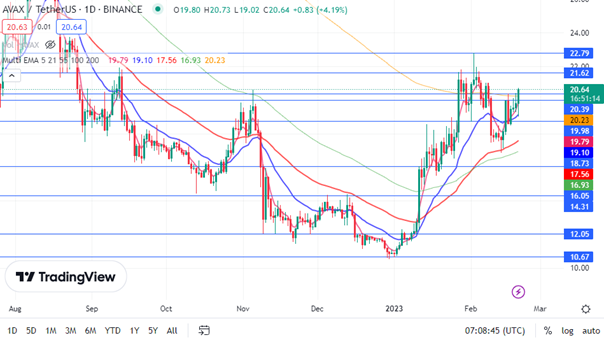
At the time of writing, AVAX is trading at $20.64, with a daily increase of 4.19%.

AVAX Chart Analysis
Starting the new week with hard purchases, AVAX will first want to go towards the resistance level at $21.62 if AVAX, which is seen to have broken the 200-day average up when the chart is examined, will continue to rise. In possible retracements, the level of $ 20.23, which is the EMA200, is the first support, and then the level of $ 19.79, which is the EMA5, is the second support. Especially if the 25212 resistance is broken on the Bitcoin side, I think that the purchases in AVAX will continue getting harder.
This article does not contain investment advice or recommendations. Every investment and trading move involves risk, and readers should conduct their own research when making a decision.
You might check: What is Biconomy Token and How Does it Work?